“The ultimate yardstick of national power is military capability.” So declared RAND analysts in a monograph on measuring national power twenty years ago. Yet, no go-to measure of military assets currently exists beyond one-off net assessments of fighting forces, simple comparisons of military spending, or point estimates of firepower that conflate capabilities with combat power.
We need a better yardstick—a military equivalent to the apocryphal king’s yard, perhaps—to measure military capability and understand its relationship with various inputs. To that end, our research team has constructed the Military Equipment Index (MEI). While still a work in progress, the index highlights important insights. Based on it, for example, we see that the Russian share of global military spending in 2015 was 4 percent, while the MEI estimates its share of capabilities to be at 9.1 percent. On the flipside, Saudi Arabia accounts for over 5 percent of the world’s military spending but has around 1 percent of total capabilities. Not all defense spending, it seems, translates to a proportionate increase in capability.
The index also allows analysts to understand important trends in a nuanced and granular way, including America’s clear military predominance since the end of the Cold War, Russia’s steady decline since that time, and China’s gradual rise since the early 2000s.
How the Military Equipment Index Works
The MEI is a general, weighted, relative measure of total medium and heavy equipment stocks possessed by each country’s military in a given year. It measures the relative quantity, modified by technological capabilities, of military hardware by domain for all countries from 1970 to 2015. Built from the ground up based initially upon International the Institute for Strategic Studies’ (IISS) Military Balance volumes, which we standardize across time and organize by technological generation, the MEI can be used to explore the following:
- Which country has the greatest military capability across time?
- Do some countries have relative preferences for greater capability in certain domains (e.g., air, land, sea)? Does this change across time?
- How does military spending relate to the accumulation of military capabilities?
We describe the MEI as a general measure because equipment generations are given scores that reflect their average worth across a variety of missions and conditions (similar to the logic behind US Army Training and Doctrine Command’s description of combat potential values). The index is weighted because a simple sum of military hardware neglects technological advancements across time, where more modern equipment is posited to have greater capacity to accomplish its primary mission. The index is a total measure because we aggregate the entire weighted inventory of a country’s armed forces without accounting for the location of items or whether they are active, reserve, or in-store (the argument being that most reserve and in-store equipment can be activated within a year’s time). The index is relative because it presents the total value of a country’s weighted military equipment as a share of the global total. These items are largely restricted to medium and heavy equipment to align with the IISS Military Balance coding practices, which exclude small arms. Finally, it is important to emphasize that the MEI is a measure of stocks, which can be counted at any point in time and typically persist over long periods. An example of MEI scores by weapon subtype for the Royal Brunei Air Force in 1993 is displayed in Table 1.
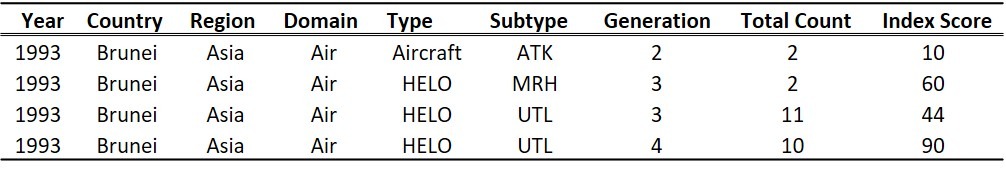
Note: HELO = helicopter; ATK = attack; MRH = multi-role helicopter; UTL = utility. Index scores are calculated by multiplying an assigned weight (shown in table 3) according to weapon type and subtype generation (e.g., a generation 2 attack aircraft) by the total count in a country’s inventory.
While the MEI can be used to inform quantitative assessments of relative military power, it is certainly not a comprehensive tool for thinking about the distribution of capabilities in the international system. It does not account for key components of combat power, including geographic, human, and other factors, some of which are quantifiable (e.g., training hours) and others of which are not (e.g., esprit de corps). Rather, when assessing combat power, it is a “largely subjective estimate.” Still, US Army Field Manual 6-0, Commander and Staff Organization and Operations acknowledges that the assessment of combat power does rely on “some numerical relationships.” Individual country values can be weighted by an assessment of training capabilities, for example, to introduce aspects of troop quality to the measure.
Although the index has obvious limitations, it can be used as a foundation from which to begin these at-first numerical, though ultimately qualitative, evaluations. This is not unlike military planners’ calculation of relative force ratios on the battlefield. Even when accounting for a specific tactical situation, planners must acknowledge that their “computations give the staff a feel for relative strengths and weaknesses, but not absolute mathematical answers as to what friendly or enemy forces will do.”
Given the total nature of our weighted measure (i.e., entire inventories are counted irrespective of their geographic location), this index is meant to inform the strategic level of analysis, where national policies are being formulated and implemented. Where major operations and tactical engagements are concerned, our weighted measure could be applied to specific equipment but would serve as just one of many inputs of the planning process. For example, equipment weights could be used as micro-level inputs into the US Army Command and General Staff College’s Correlation of Forces calculator. Here, “the goal for using the calculator is not so much to predict the outcomes of engagements as it is to add some objectivity to the force allocation process.” In other words, using the MEI as an input into planning calculations should be seen as the beginning—not the end—of an analysis.
Even at the strategic level, we acknowledge that weighted counts of military equipment possessed by countries will not fully capture the power of their armed forces in conflict. Indeed, Kenneth Pollack’s recent analysis of Arab military effectiveness in Armies of Sand highlights how cultural dynamics and politicization of the armed forces can lead larger, better-equipped militaries to be defeated by significantly smaller ones.
That said, the MEI is a significant improvement relative to another often-used proxy measure for total military capabilities: military spending. As the founder of net assessment Andrew Marshall noted, broad measures of effectiveness are “useful in understanding long-term trends,” even if “they clearly fail as predictors of outcomes of military operations between opposing forces.” By contrast, military spending is often obscured by “double bookkeeping, the use of off-budget financing, highly aggregated budget categories, security assistance, and governmental manipulation of foreign exchange,” as well as different standards of living. Military spending is also prone to large annual fluctuations.
Aside from being used for comparisons between countries—which can be made from 1970 through 2015 for more than 180 countries using this index—the MEI can be used for intra-national comparisons by viewing the data at the domain- or even equipment-type level. As RAND analysts have noted regarding the importance of tracking disaggregated military expenditures, “Understanding the distribution of resources among the various services provides a preliminary view of a country’s understanding of the salience of relative threats, its desired structure of combat proficiency, as well as the relative power of various military bureaucracies.”
Methodology
The MEI is the product of a multi-year research and analysis project seeking to better understand the relative distribution of military capacity worldwide in the past, present, and future. Individual lines of effort in our index construction process have included data collection, cleaning, aggregation, generational bucketing, weighting, and sensitivity analyses.
In collecting and cleaning the underlying data on heavy military equipment stocks, our research team established techniques to uniformly categorize information in a manner that was consistent from 1970 through 2015 and can be analyzed in panel format. In part, this required re-categorizing many equipment items into groups different from the categorizations in various IISS Military Balance volumes.
Next, the data were aggregated on multiple levels. First, equipment variants were collapsed into broader equipment families. For example, an F-35A, F-35B, and F-35C would all be classified simply as an F-35. For certain systems, this required judgement calls as to whether a given variant could appropriately be grouped into a broader family or if it should be classified as its own family given any generationally unique features. Equipment families were then assigned to equipment subtypes (e.g., F-15, F-22, and F-35 belong to the “Fighter” equipment subtype), and, within those equipment subtypes, bucketed into generations. These generational buckets were derived from open-source research materials, a Pardee Center–developed bucketing methodology, and solicitation of subject matter expert opinions. Briefly, generations were assigned based upon specific equipment characteristics across four broad categories—offense, defense, maneuverability, and network capabilities—and category-specific thresholds. An example for minesweepers is presented below in Table 2.
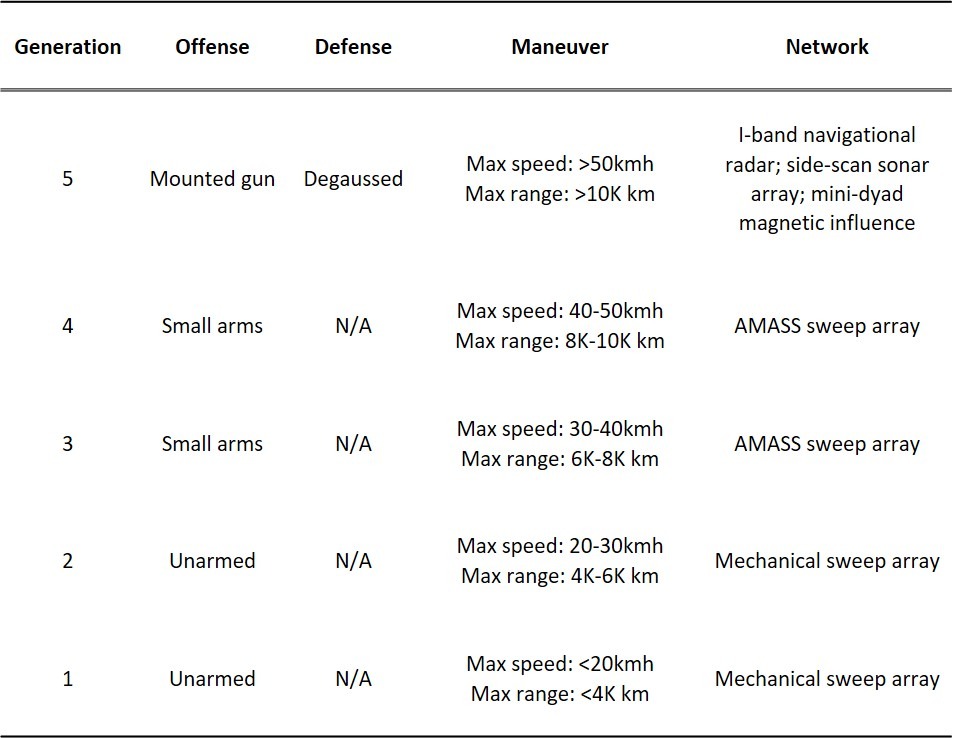
Note: AMASS = Australian Minesweeping and Support System, a mechanism involving buoyant magnetic cylinders capable of mimicking electromagnetic signatures of various vessels.
Once aggregated into more than four dozen equipment subtypes, each with its own unique generational categories, Pardee Center research team members then qualitatively assessed the relative value of each data point. At first, a toy model was created, where weights were iteratively assigned and reassigned based upon heuristic judgments and comparisons to an equally weighted (i.e., raw equipment count) index. We then conducted a sensitivity analysis for these weights, comparing the MEI in its present form with reduced versions using other expertly assigned weights, such as the ground force scoring system developed by the RAND Corporation’s Strategy Assessment System and the US Army Concepts Analysis Agency’s (now the Center for Army Analysis) Weapons Effectiveness Index scores. (It is important to remember, however, that our index, in contrast to these measures, is not meant to directly measure combat power.) We also compared the MEI with the lagged ten-year sum of military spending treated with a 10 percent annual discount rate (derived from analysis from RAND). An example of the resulting weights derived from this process is displayed in Table 3.

Note: See Table 1 for explanation of abbreviations.
Preliminary Analysis
Though we continue to refine the MEI, our work thus far has revealed several general patterns. These include the persistent dominance of the United States in terms of total, generally weighted stock of heavy and medium military equipment (exceeding one-quarter of the annual global total from the 1970s through 2015) and China’s gradual rise. (We suspect that data from the last five years will show a considerably more rapid increase given the introduction of aircraft such as the Chengdu J-20.) Meanwhile, Russia’s precipitous decline since 1991, while reflective of the country’s recovery from the fall of the Soviet Union and the gradual decommissioning of Soviet-era equipment, is perhaps somewhat exaggerated given that our index does not capture the partial reinvention of the Russian military in the years following its struggles during the 2008 invasion of Georgia. These trends are illustrated below in Figure 1, which displays countries’ share of the annual global total of generally weighted medium and heavy military equipment stocks.
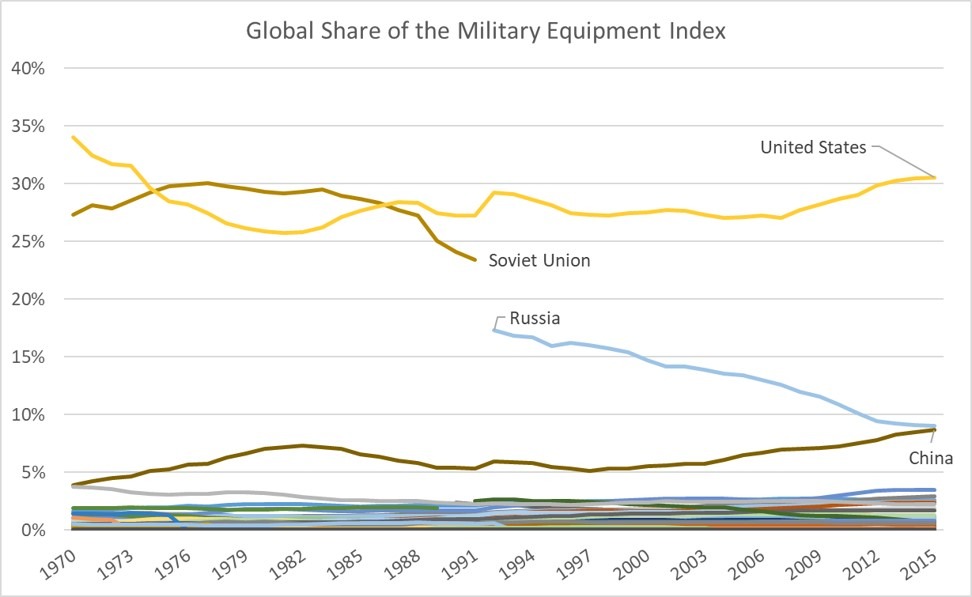
As of 2015, the United States possessed a sizeable portion of the world’s weighted medium and heavy equipment stocks at 30.5 percent, a value more than triple that of either Russia (9.1 percent) or China (8.7 percent). By contrast, these countries’ global share of military spending in 2015 was as follows: the United States spent 36 percent of the world share, China 13 percent, and Russia 4 percent. The largest disparity, however, is credited to Saudi Arabia, which accounted for 5.2 percent of global military expenditures in 2015 but possessed only 1 percent of the weighted global stock of medium and heavy military equipment.
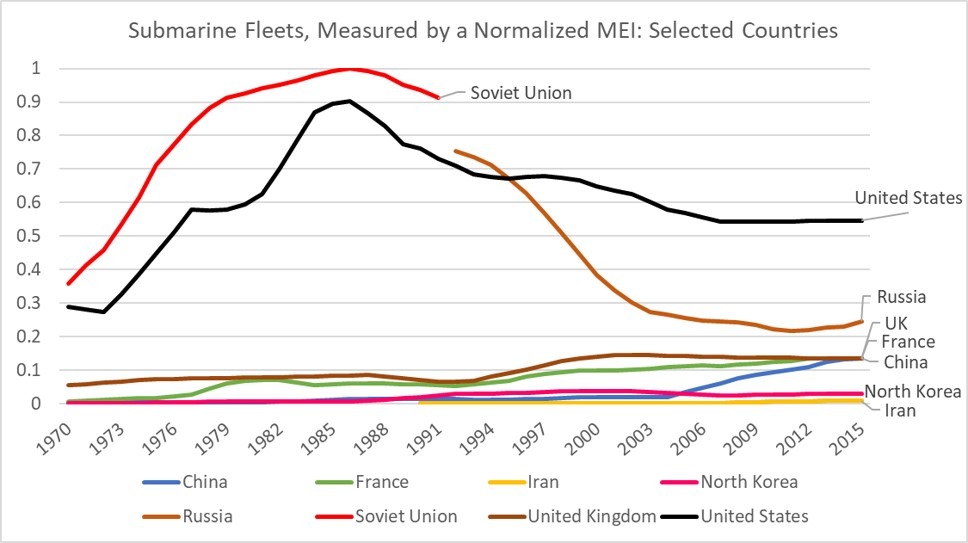
While the values presented in Figure 1 are certainly subject to debate given potential differences of opinion on generational bucketing and weighting decisions, they nonetheless highlight interesting historical patterns. For example, Figure 2 illustrates how the US and Soviet submarine fleets swelled toward the end of the Cold War. China’s rise over the past two decades is evident as well.
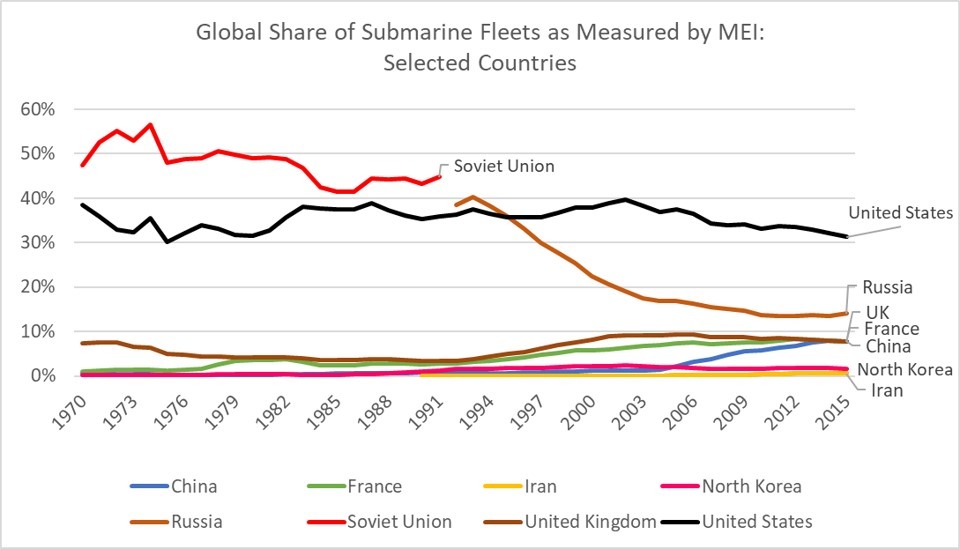
At the same time, Figure 3, which evaluates the MEI in relative terms, illustrates that the United States’ global share of weighted submarine fleet stocks has held relatively steady (between 30 and 40 percent of the global total).
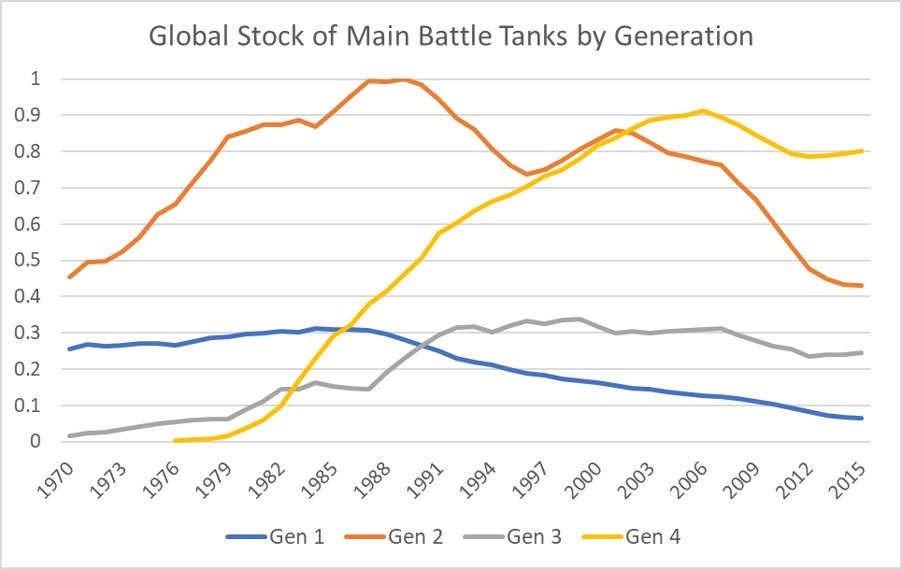
Beyond enabling country comparisons, the MEI can also be used to track global technological shifts. In Figure 4, for instance, notice that many countries have transitioned from large stocks of relatively low-technology main battle tanks to smaller stocks of much more capable high-technology tanks. Still, a handful of countries still maintained stocks of Generation 1 main battle tanks as of 2015, including Iran’s possession of M47 Pattons—tanks that were first fielded in the early 1950s.
An Invitation to Collaborate
The work we’ve presented here is the opening of what we hope to be a broader conversation with both professional and amateur analysts across the national security community—Modern War Institute readers like you. You can view a sample of the data here. For those interested in providing feedback, we would love to hear from you directly. We’re seeking to identify potential collaborative partners to help continue to push this research forward. Similar to our intended use of the MEI in national security policymaking and analysis, we see this research as the beginning, not the end.
Disclosure statement: This work was funded by the United States Army Future Studies Group.
Collin Meisel (Twitter: @collinmeisel) is the Diplometrics Program Lead at the Frederick S. Pardee Center for International Futures and a veteran of the US Air Force. At Pardee, Collin works with the Diplometrics team and its partners to better understand and measure relationships in the international system through data gathering, tool building, and analysis.
Jonathan D. Moyer (Twitter: @moyerjonathan) is Assistant Professor at the Josef Korbel School of International Studies at the University of Denver and Director of the Frederick S. Pardee Center for International Futures. For the last fifteen years, Jonathan has used long-term, integrated policy analysis and forecasting methods to inform the strategic planning efforts of governments, international organizations, and corporations around the world, including sponsors such as USAID, the African Union’s New Partnership for Africa’s Development, and the UN Development Programme.
Sarah Guberlet is a former Research Aide at the Frederick S. Pardee Center for International Futures and former Military Equipment Index project lead.
The views expressed are those of the authors and do not reflect the official position of the United States Military Academy, Department of the Army, or Department of Defense.
Image credit: kremlin.ru
This looks like very careful and valuable work; thanks for giving us a glimpse of it here.
I understand that the MEI is a work in progress and a sample is available, but when do you expect to make the index available to your readers?
It's just a matter of carving out time for a peer-reviewed publication and then waiting for the publication to go live — a process best measured using geologic timescales… Meanwhile, I recommend Andres Gannon's unweighted rDMC dataset, introduced here: https://academic.oup.com/isq/article/67/4/sqad081/7284156. Data here: https://www.militarycapabilities.com/data.